
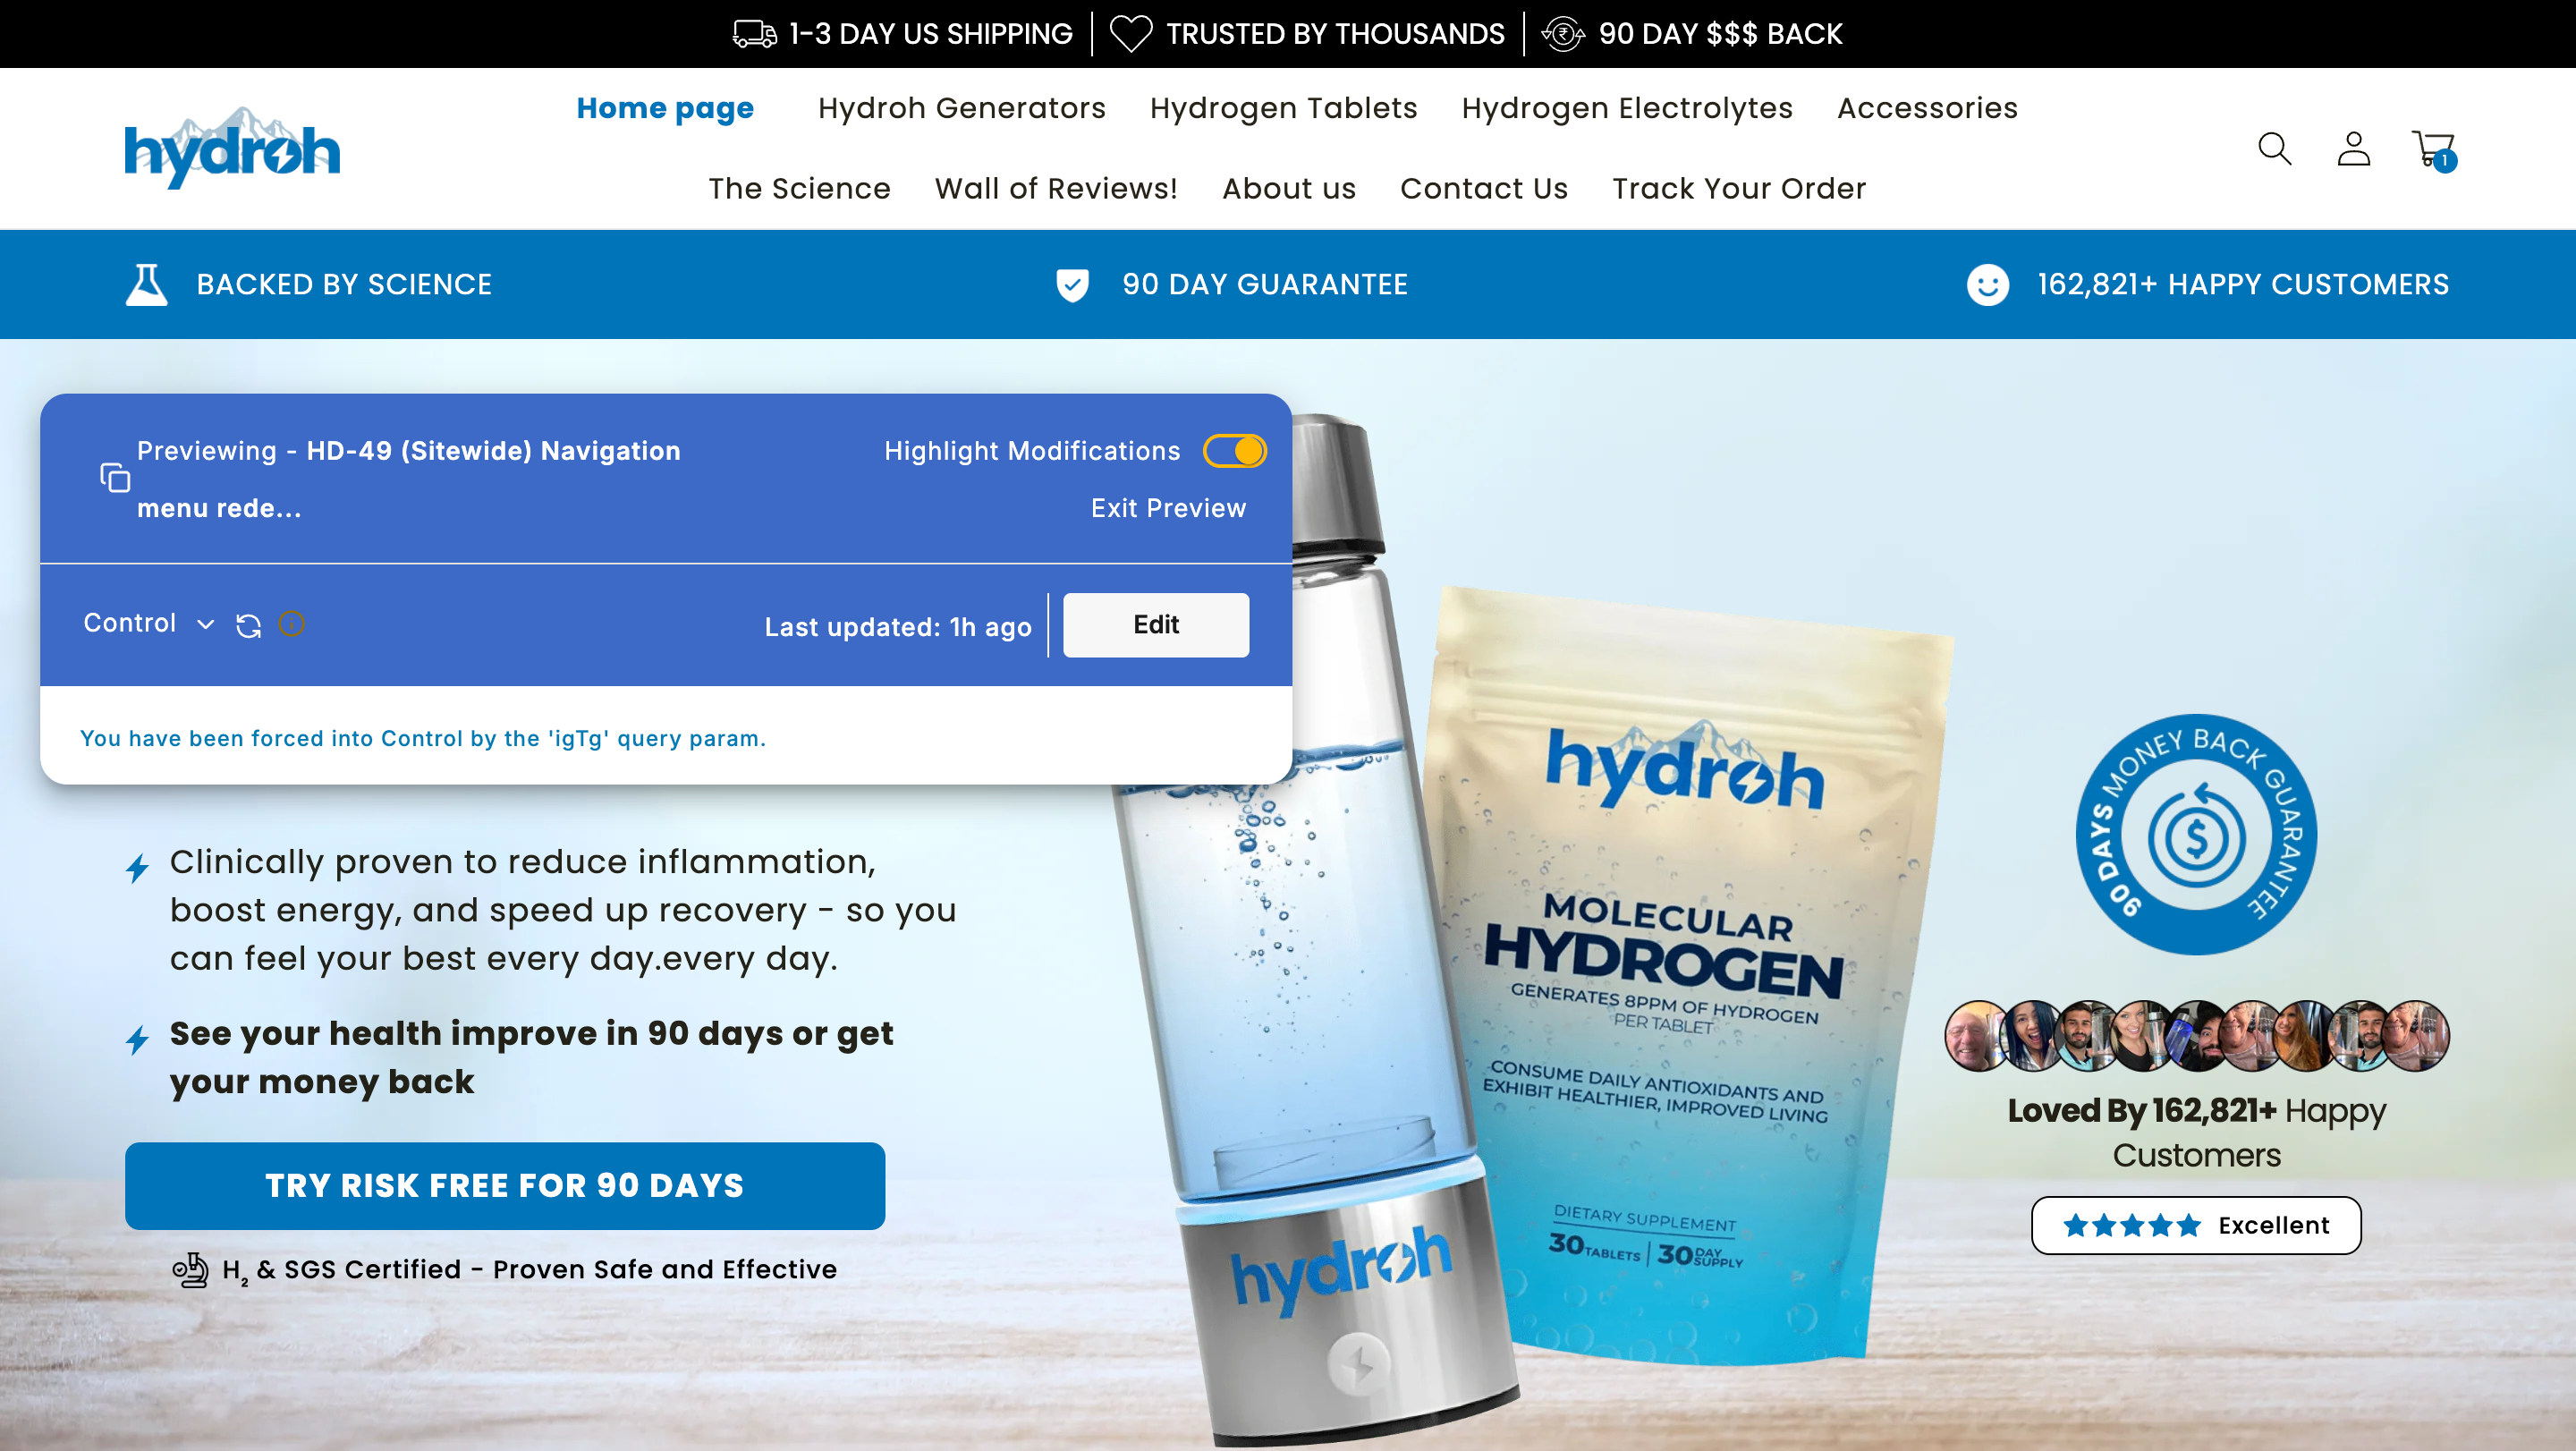
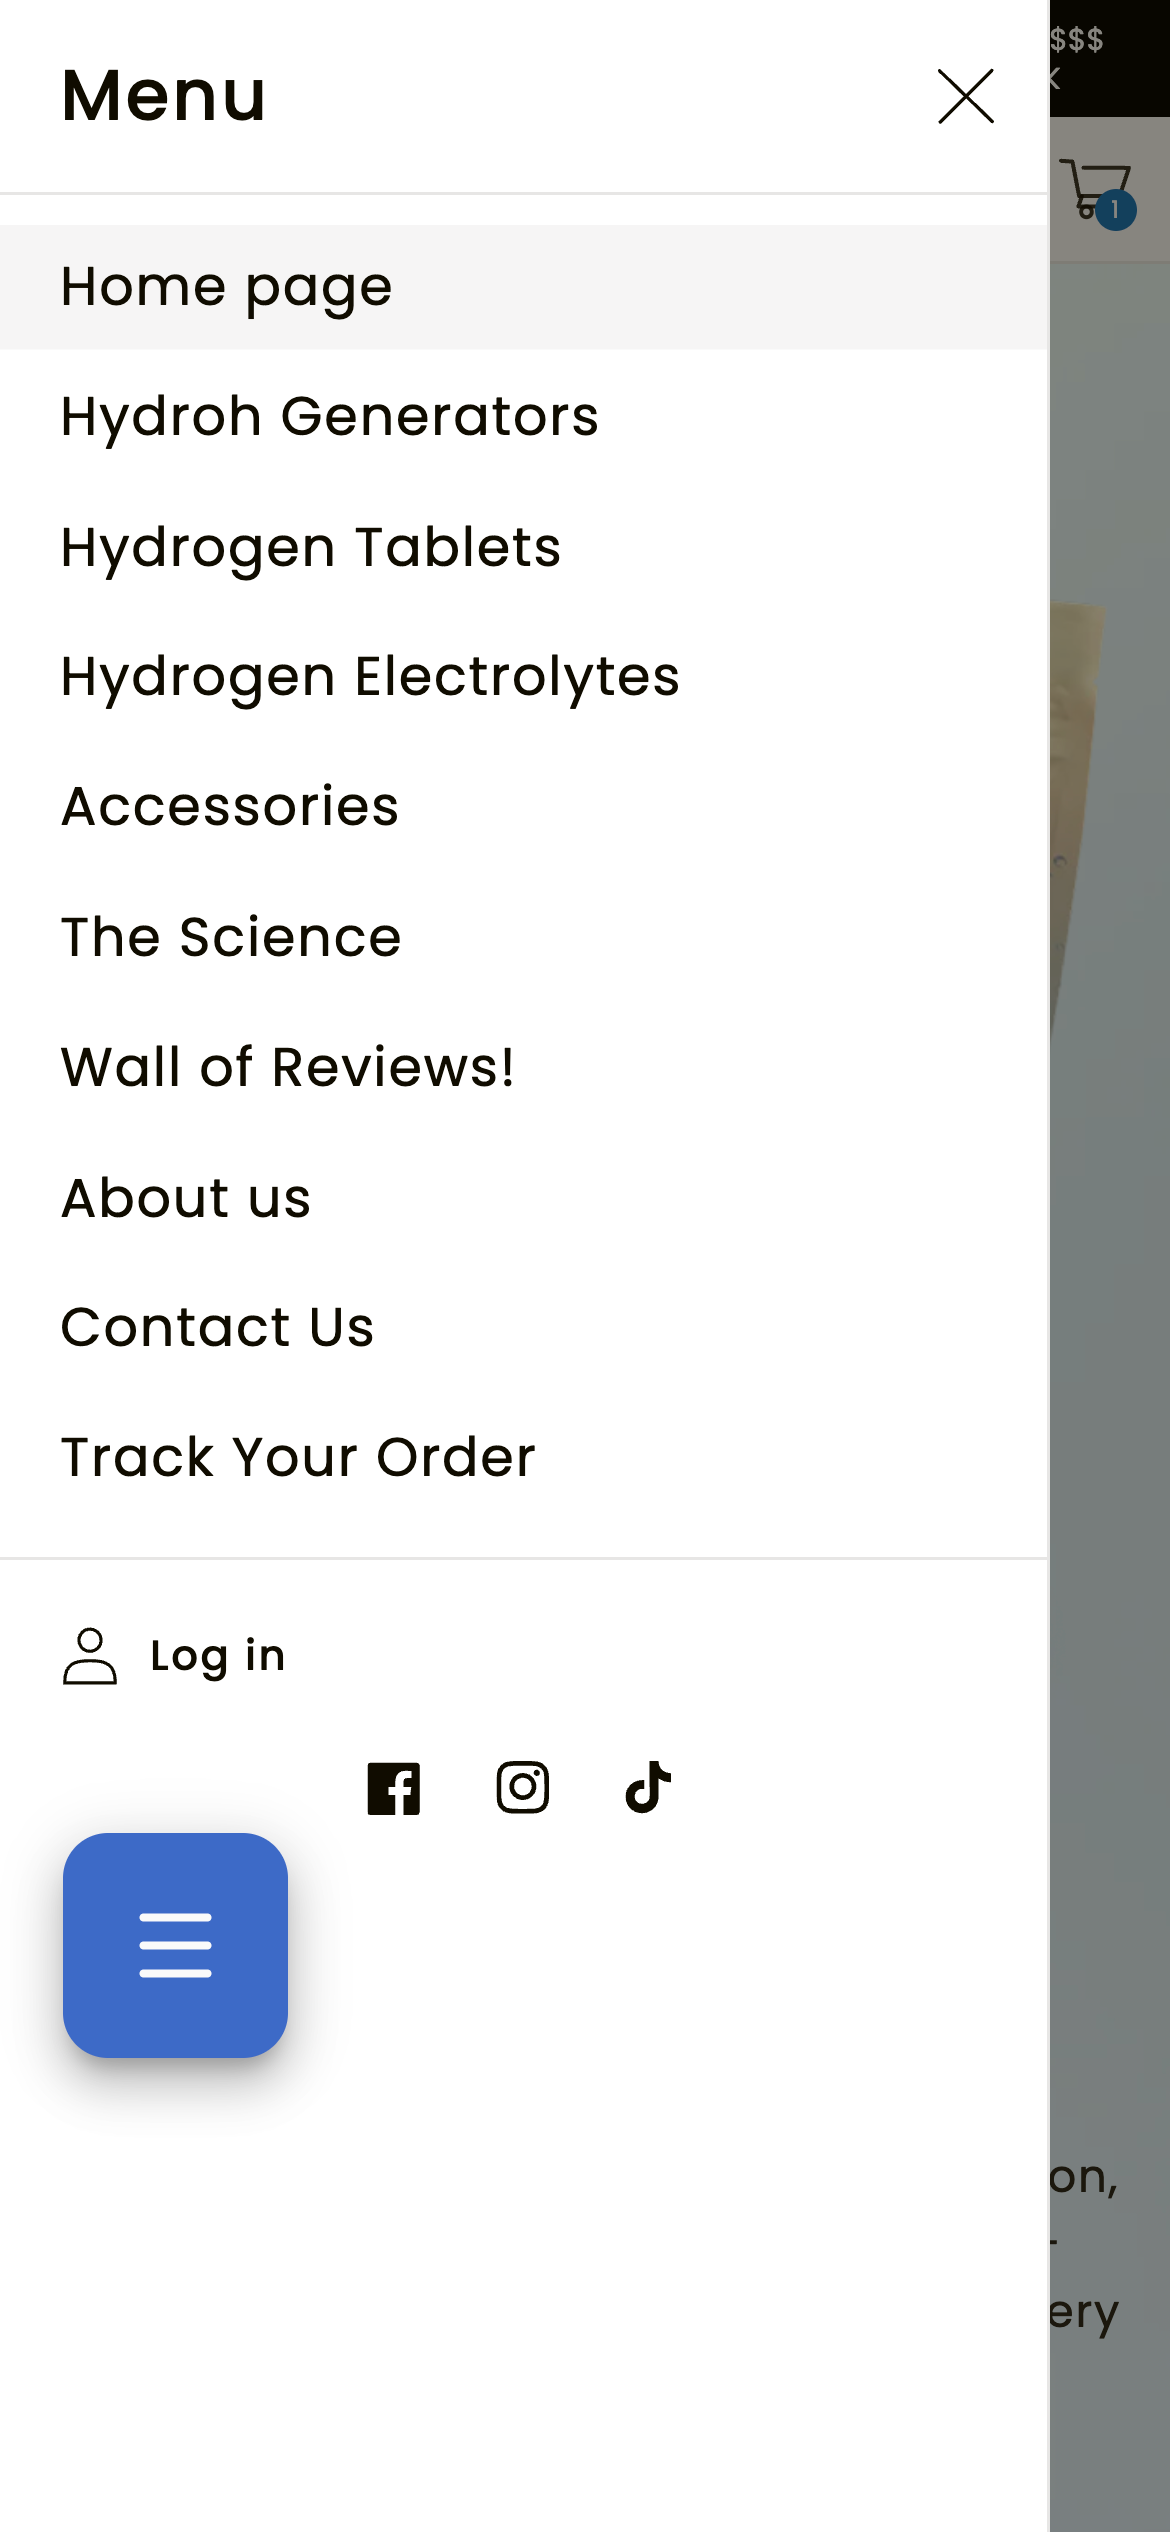
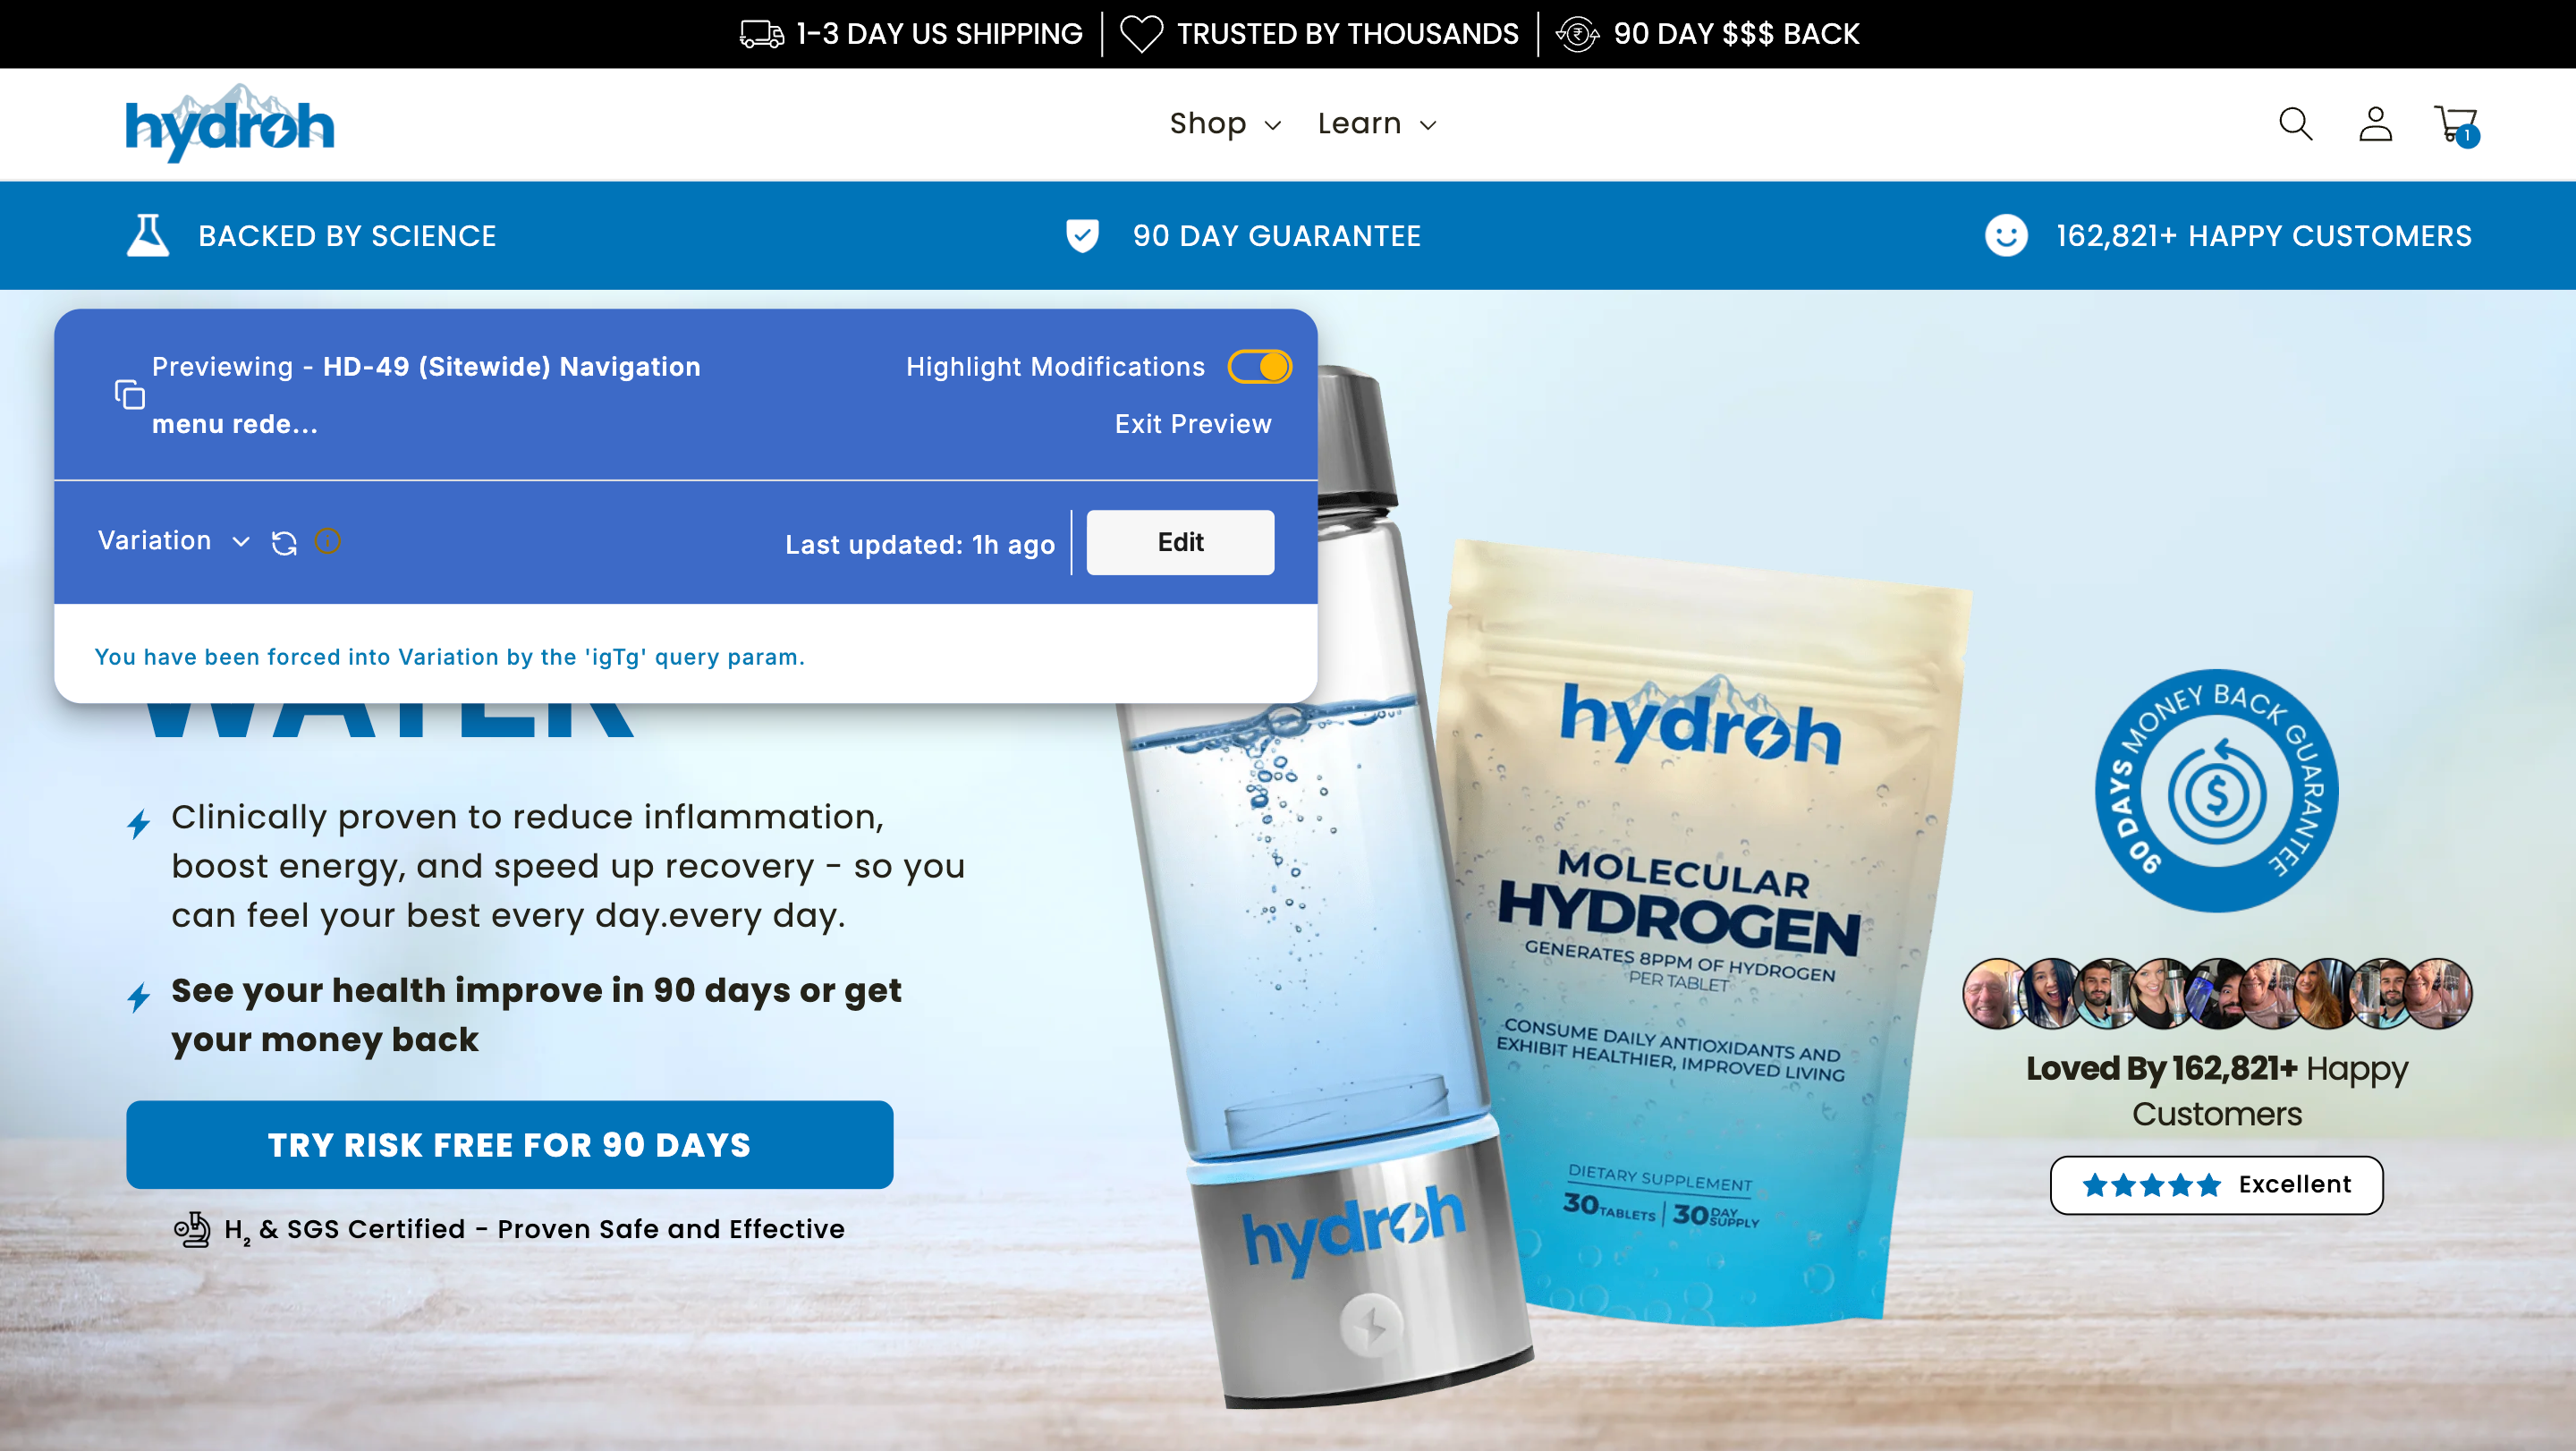
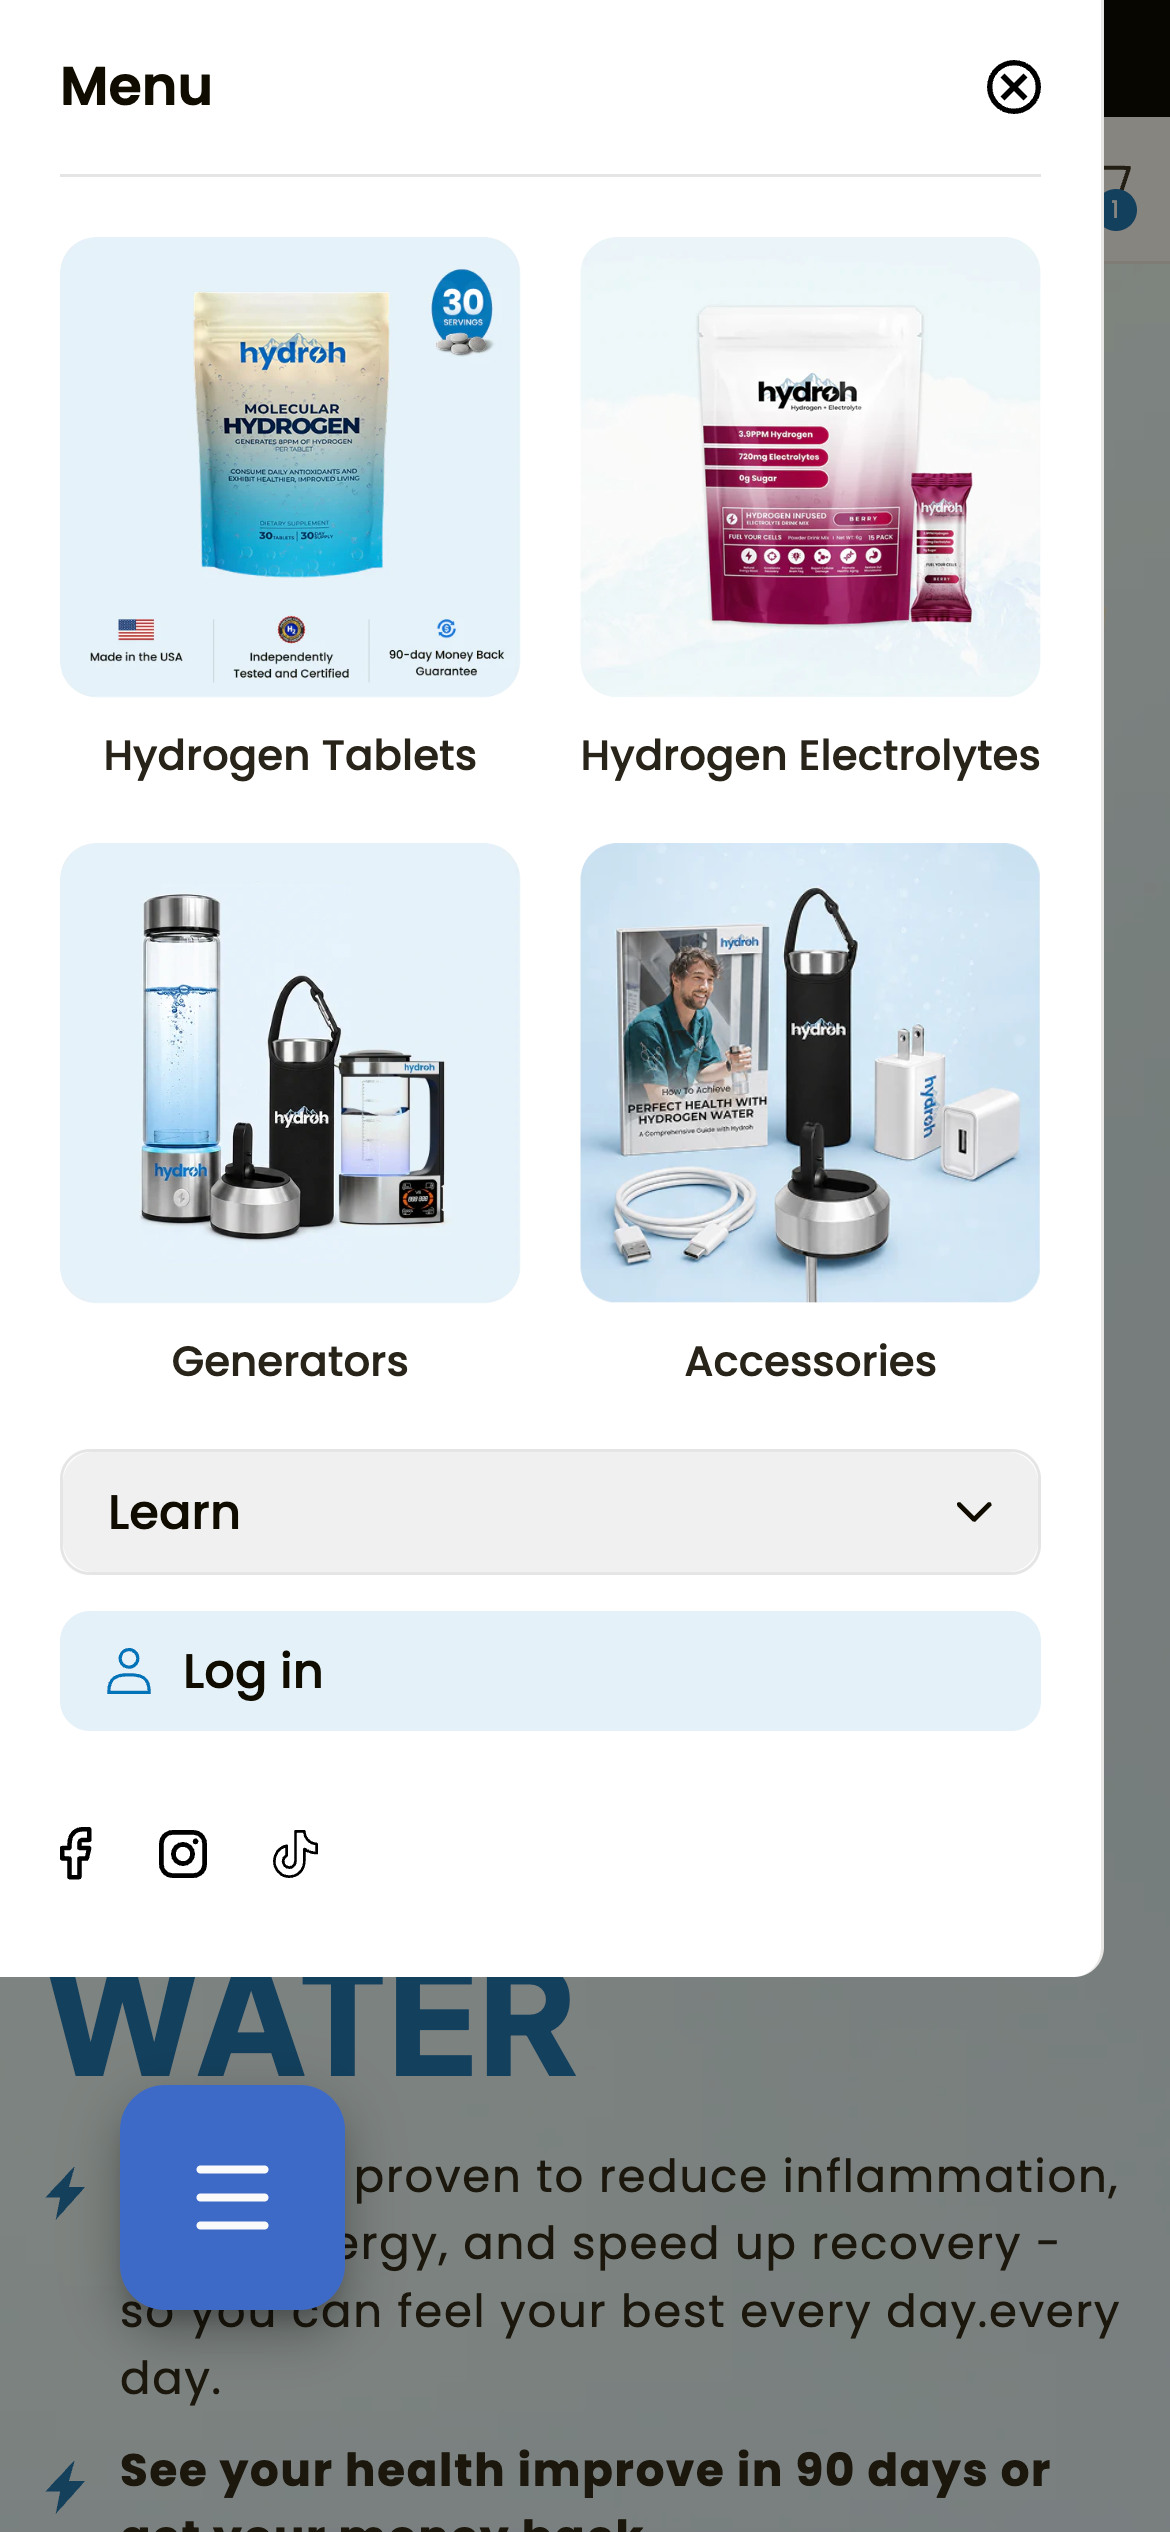
Navigation menu redesign, reprioritize menu order around Tablets + order-tracking intent
Hypothesis
By reprioritizing the navigation, elevating Hydrogen Tablets toward the top of the menu, repurposing the redundant 'Home page' slot, and surfacing a dedicated Track Your Order / account entry point higher in the hierarchy, we expect to better match revealed user intent, reduce the 42.8% mobile hamburger close-out rate, and increase nav-driven engagement and downstream conversion. Provisional pending GA4 destination CVR, Hotjar close-out recordings, and returning-vs-new traffic segmentation before finalizing a variant.
What we learned
What we tested: We reprioritized the site navigation menu, moved Hydrogen Tablets toward the top, repurposed the redundant 'Home page' slot, and surfaced Track Your Order / account access higher in the menu, to better match the homepage intent revealed in the Clarity heatmaps. What happened (11-day run, ~75,900 visitors), blended: - Conversion rate: Control 2.01% vs Variation 2.08% (up 3%) - Revenue per visitor: Control $1.80 vs Variation $1.84 (up 2%) - Average order value: Control $89.19 vs Variation $88.42 (down 1%) - Gross profit per visitor: Control $1.29 vs Variation $1.32 (up 2%) Statistical confidence (blended): About ~70% chance the new menu earns more revenue per visitor and about a 75% chance it lifts conversion rate, both below our 85% bar, so the blended result is directional, not a clear-cut call. Importantly, the blended number masks two opposite effects (see segmentation below). === Segmentation === By device: - Mobile (90.3% of traffic): Variation wins directionally. Revenue per visitor $1.69 vs $1.79 (up 6.4%); conversion rate 1.9% vs 2.1% (up 7.0%, ~89% chance better); gross profit per visitor up 6.4%. - Desktop (9.7%): Variation loses. Revenue per visitor $2.79 vs $2.27 (down 18.7%, ~85% chance Control is better); conversion rate down 18.5%; gross profit per visitor down 20.4%. The upstream funnel confirms a desktop UX problem, not noise: add-to-cart rate down 20.6%, checkout starts down 22.7%, and collection-page views down 22.7% (all high-confidence). The 4-column desktop mega-menu execution suppressed product discovery. By visitor type: - New visitors (85.2% of traffic): Essentially flat. Revenue per visitor down 0.5% (coin-flip confidence). New visitors dominate traffic, which is why the blended result looks neutral. - Returning visitors (14.8%): Strong win. Revenue per visitor $2.36 vs $2.72 (up 15.1%, ~82% chance better); conversion rate up 11.3%; gross profit per visitor up 15.2%. This validates the core hypothesis, surfacing Track Your Order / account access higher helped exactly the returning / post-purchase users it was designed for. Read: The blended ~2% lift is a weighted average of a mobile / returning-visitor win and a desktop loss that largely cancel out. The effect is real but concentrated, not uniform. === Rollout decision === Shipping MOBILE ONLY. This captures the ~6% mobile revenue-per-visitor gain (and the returning-visitor lift, which is overwhelmingly mobile) while avoiding the ~19% desktop revenue-per-visitor regression. Desktop stays on Control until the mega-menu execution is reworked and re-tested.
Want tests like this on your store?
Free teardown: we walk your store live and show you the three highest-impact tests we would run first.