
Product image overhaul
Hypothesis
Test if updating the UI of tablet's PDP, increases its conversion.
What we learned
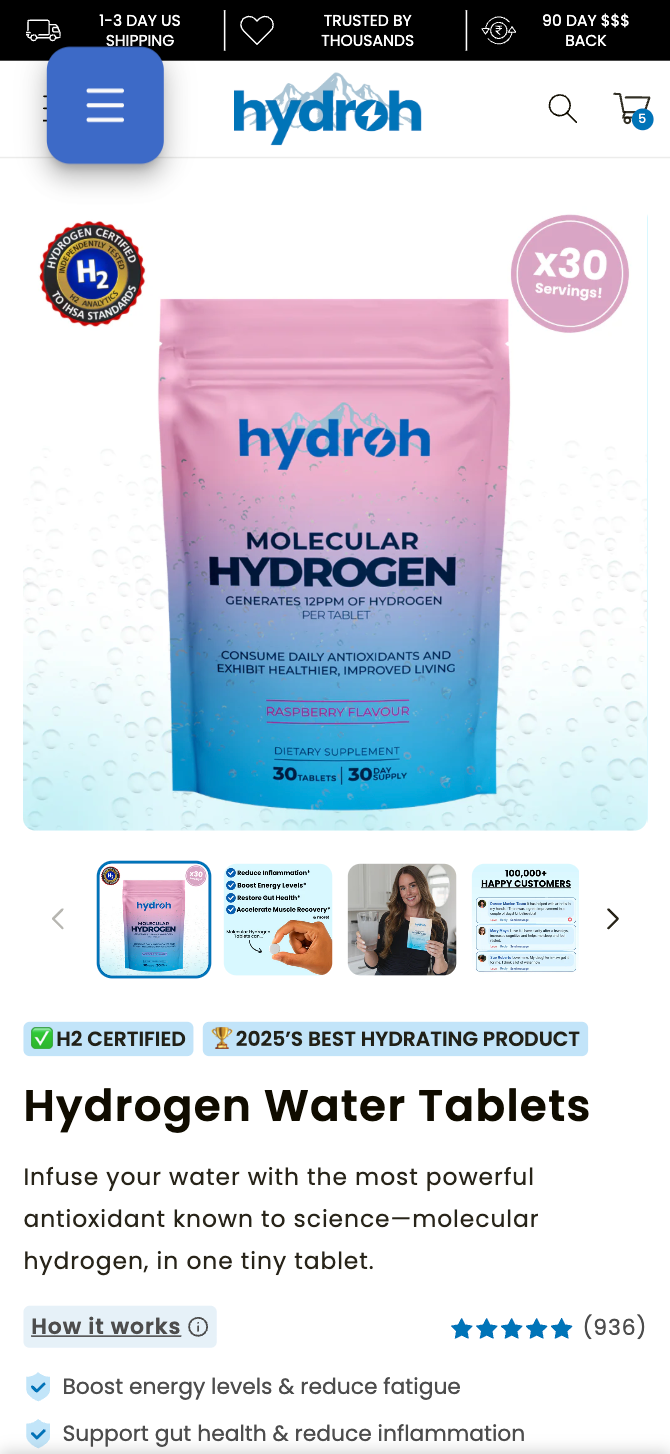
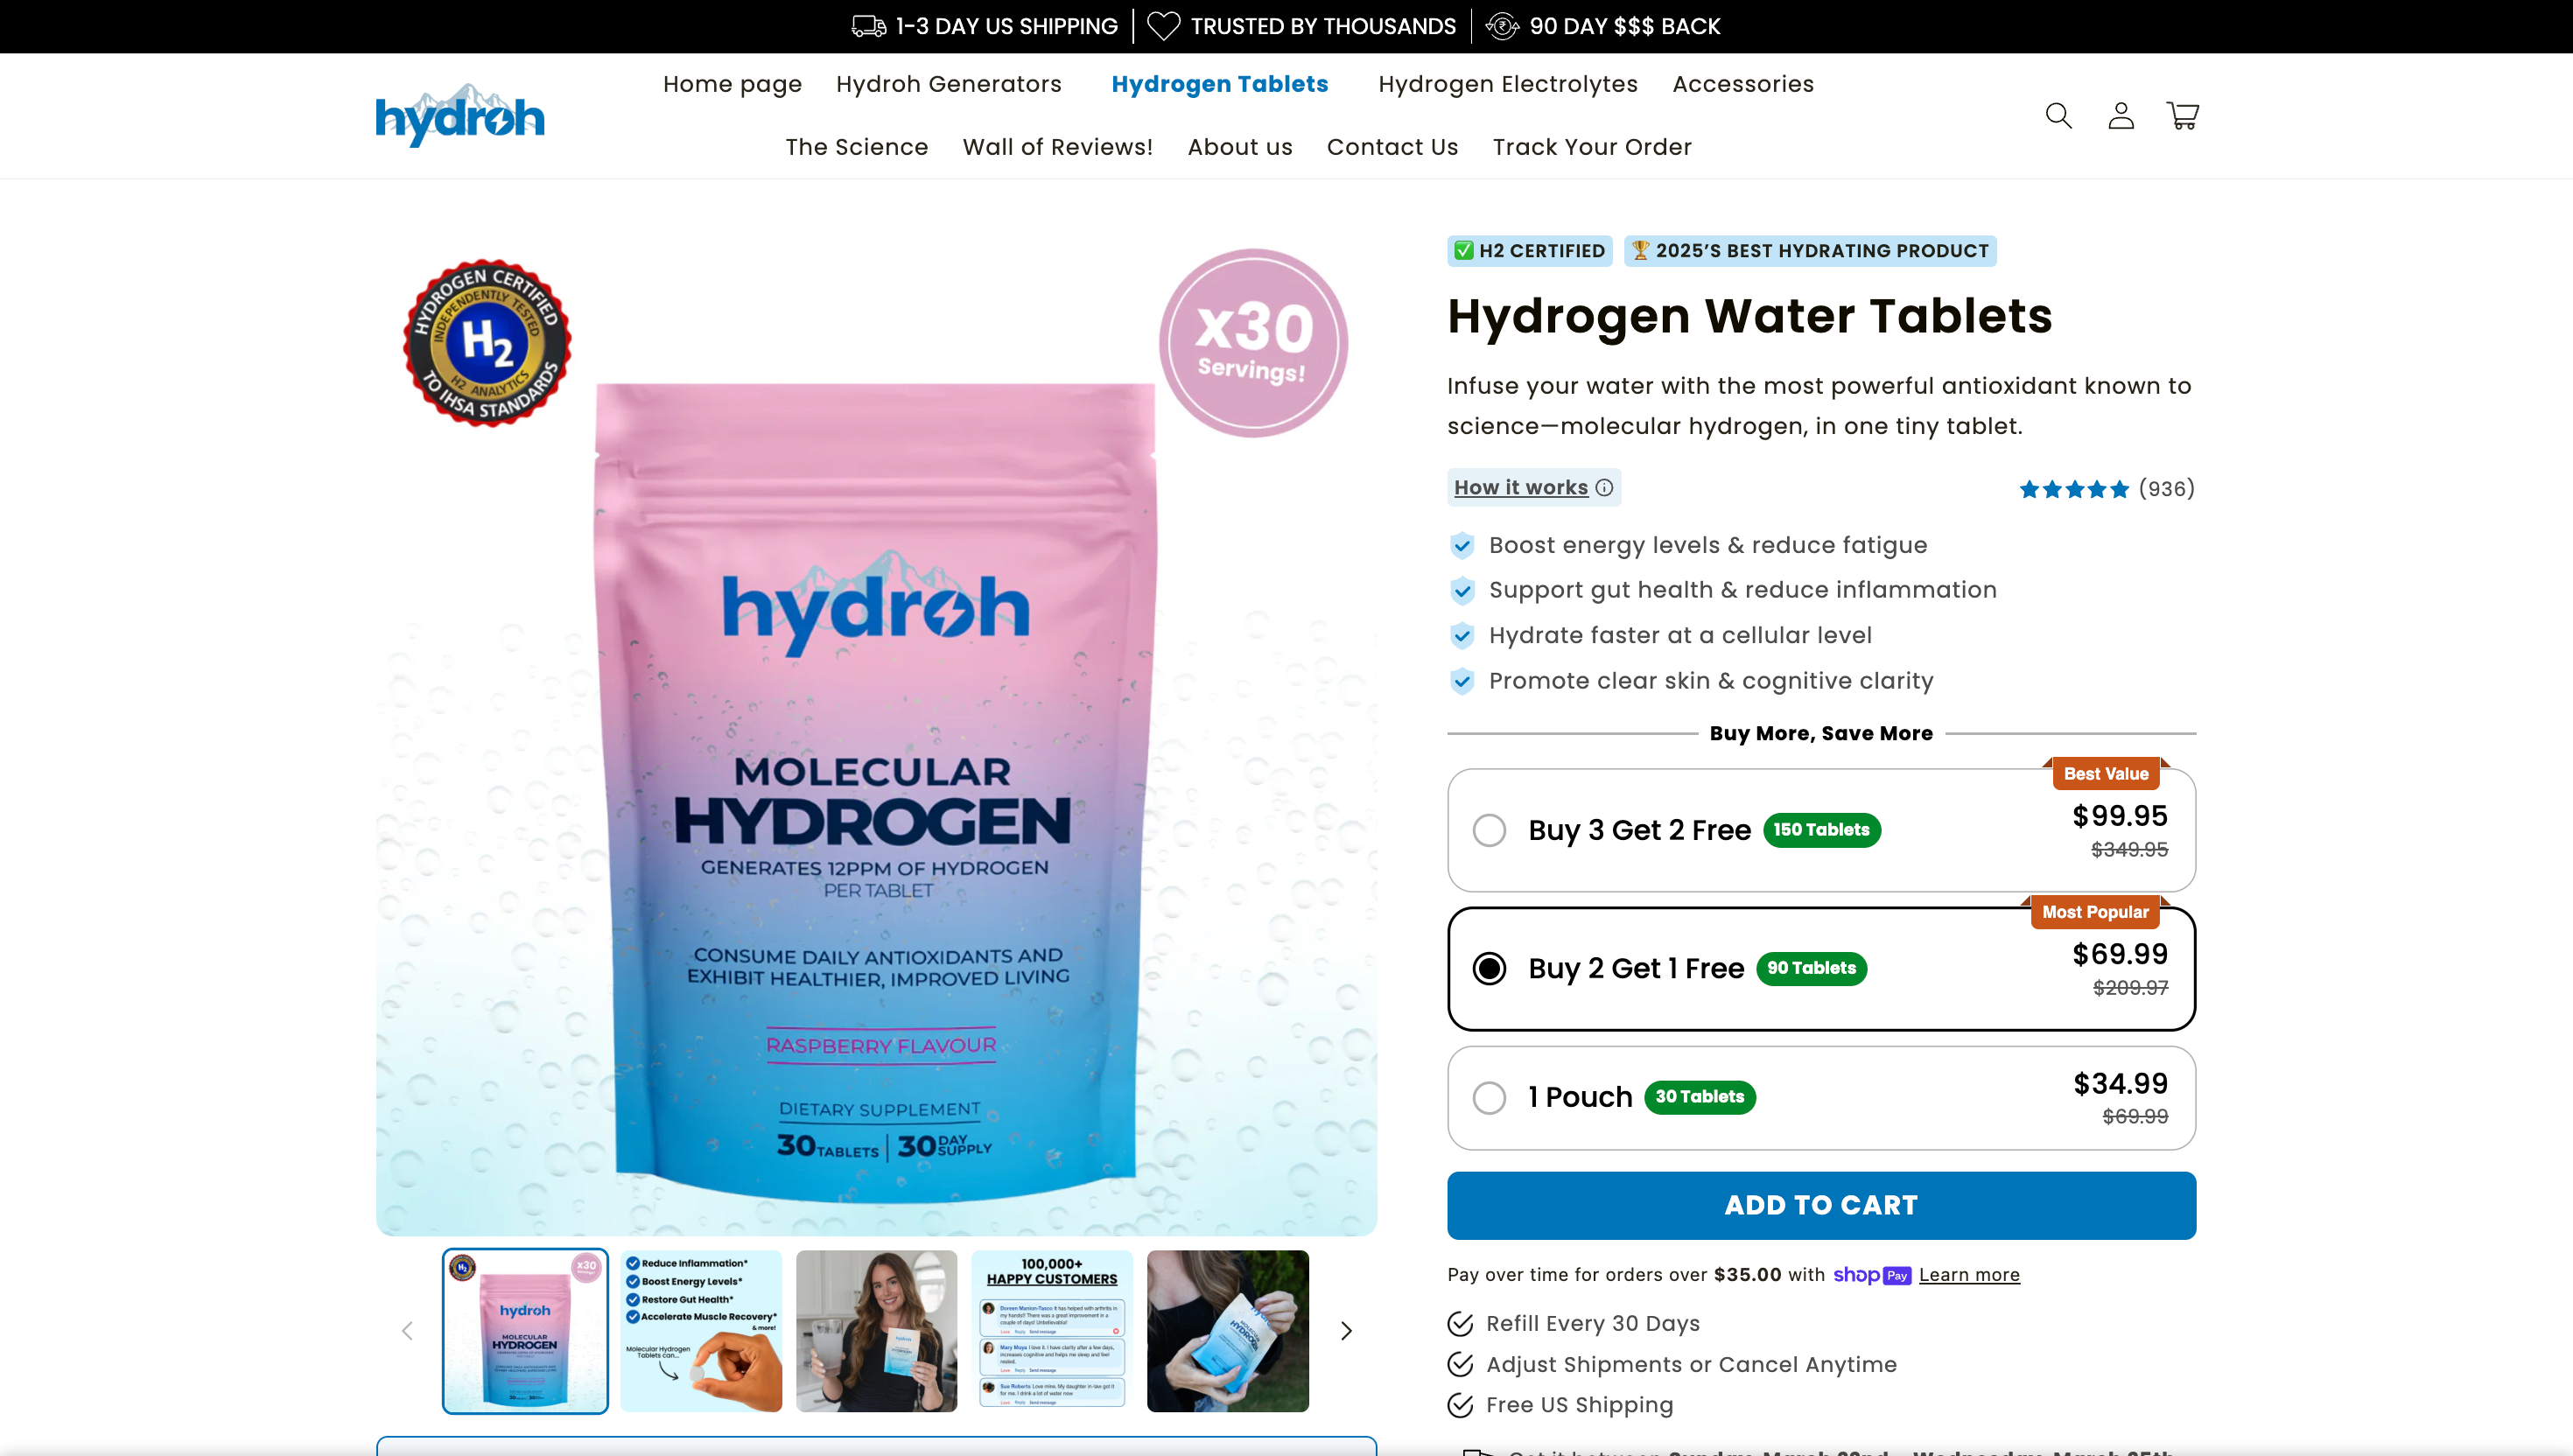
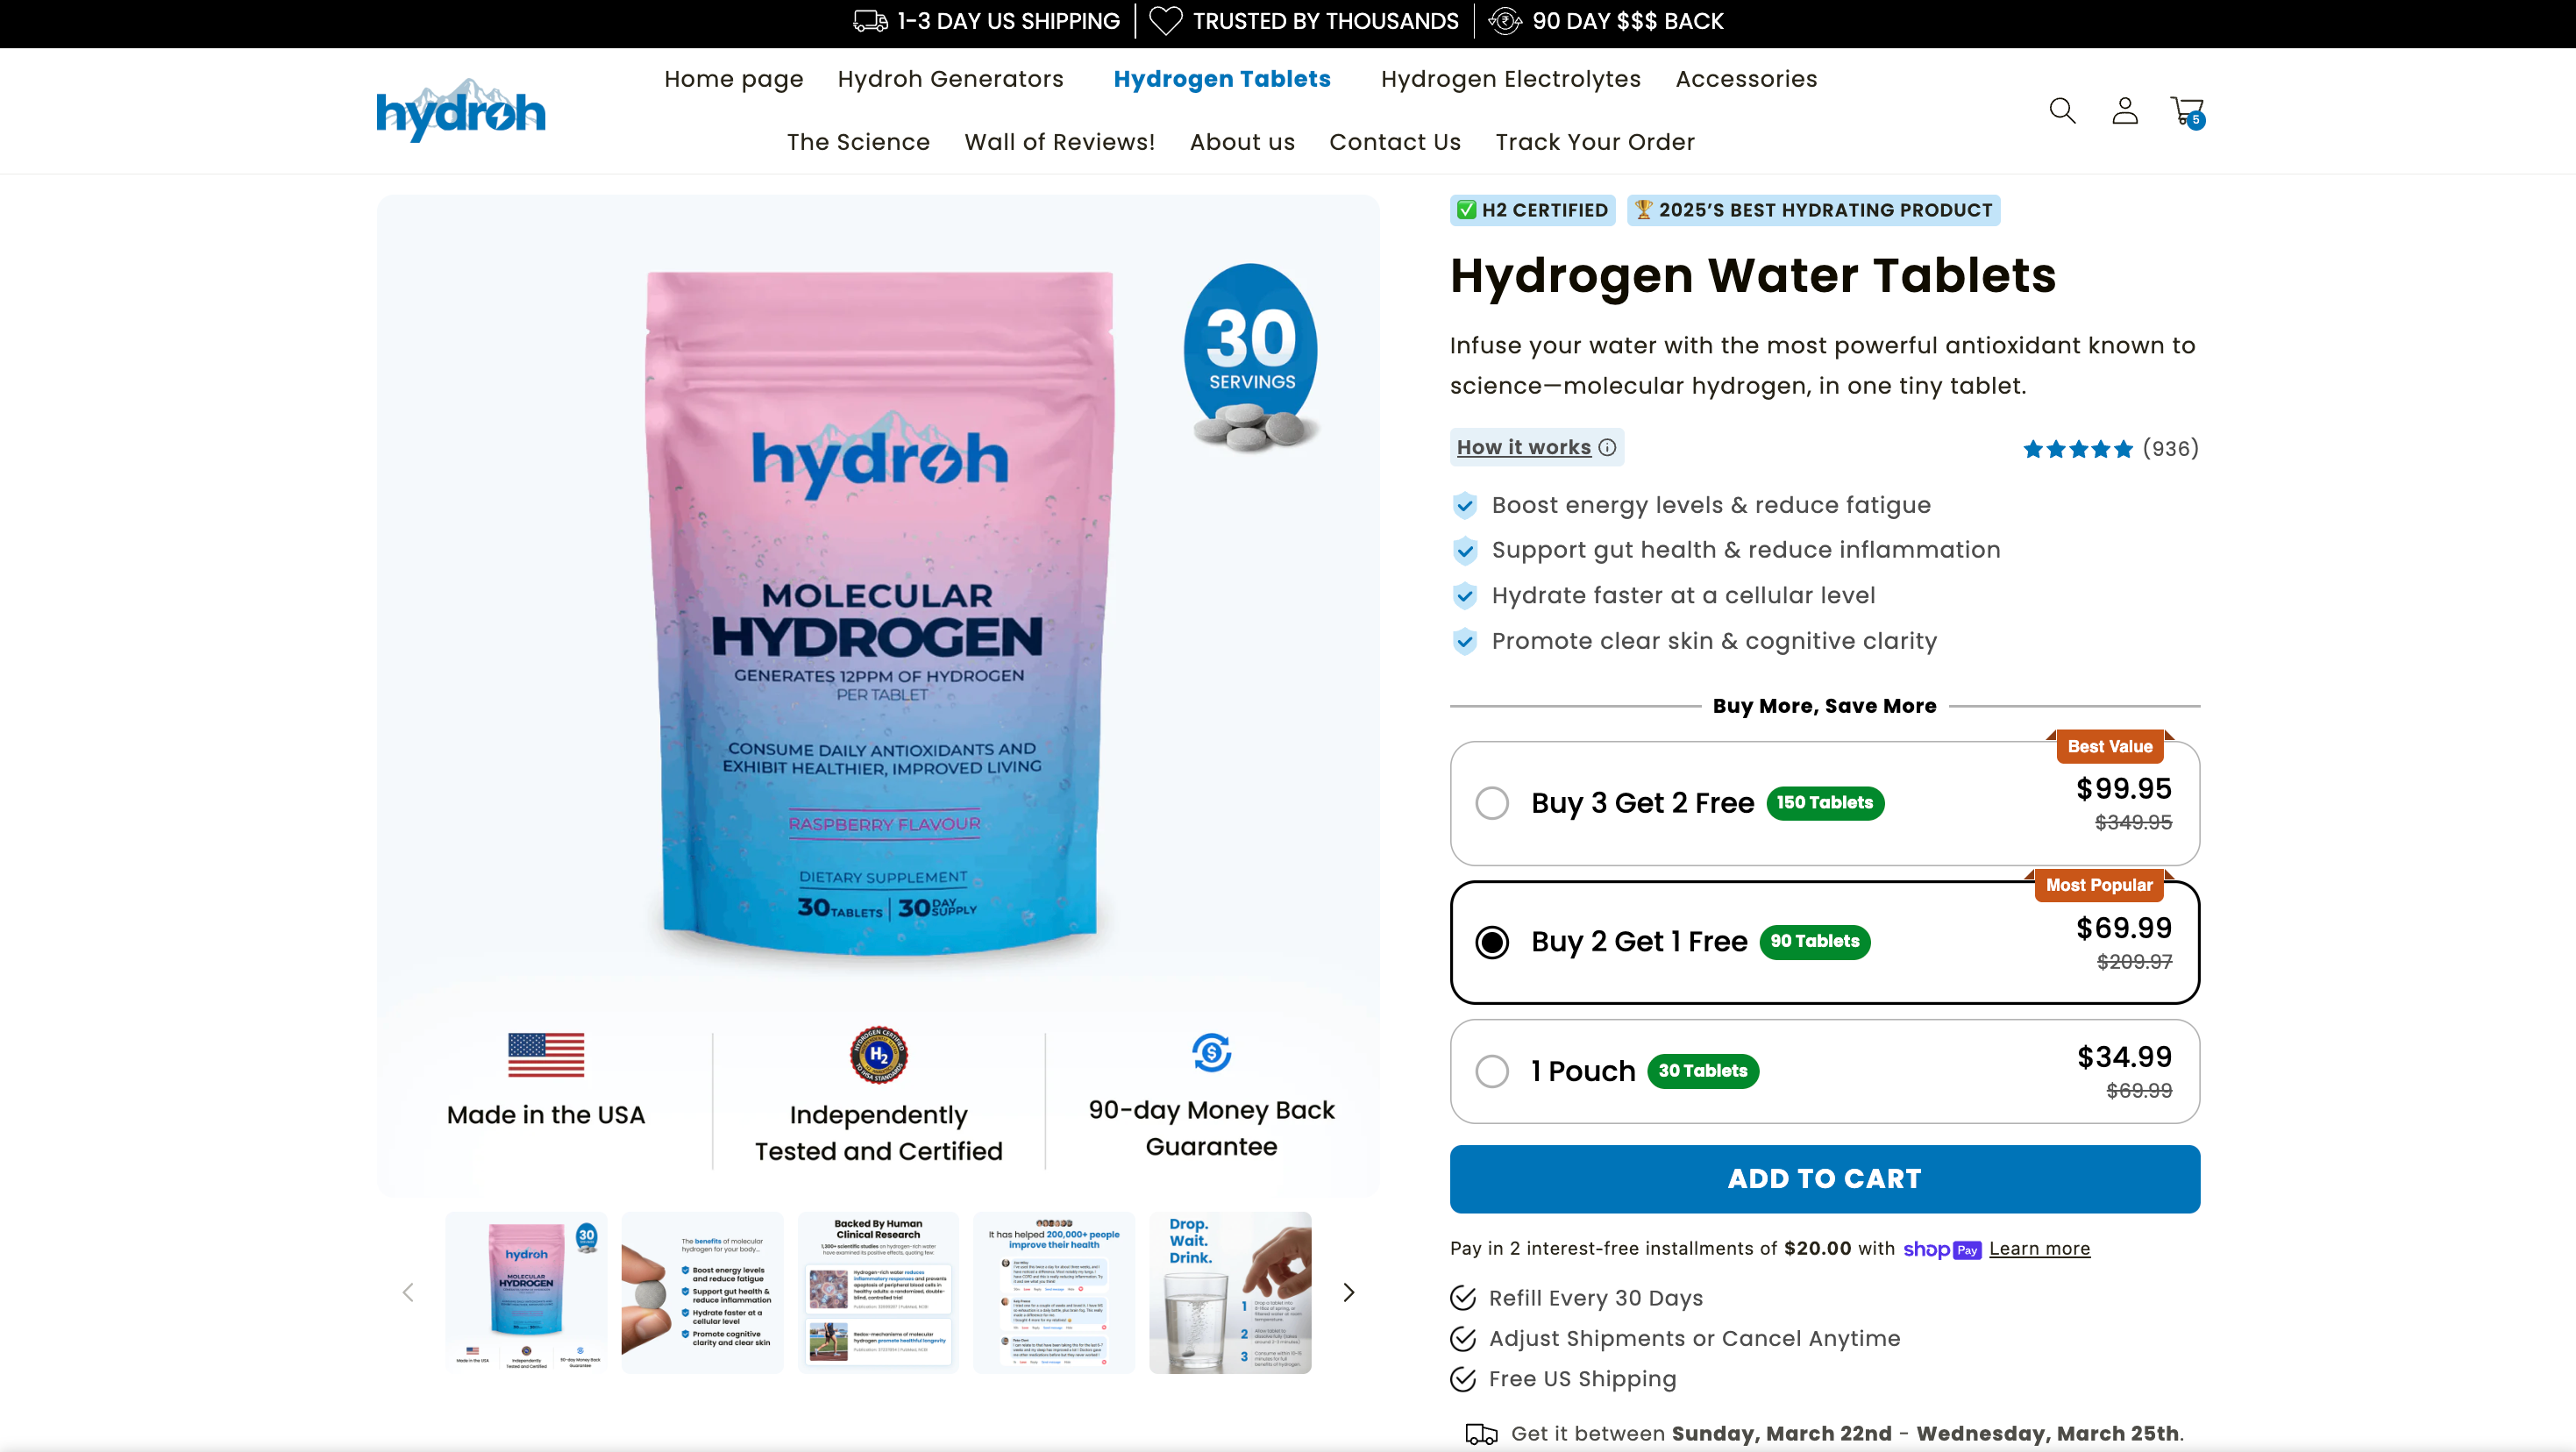
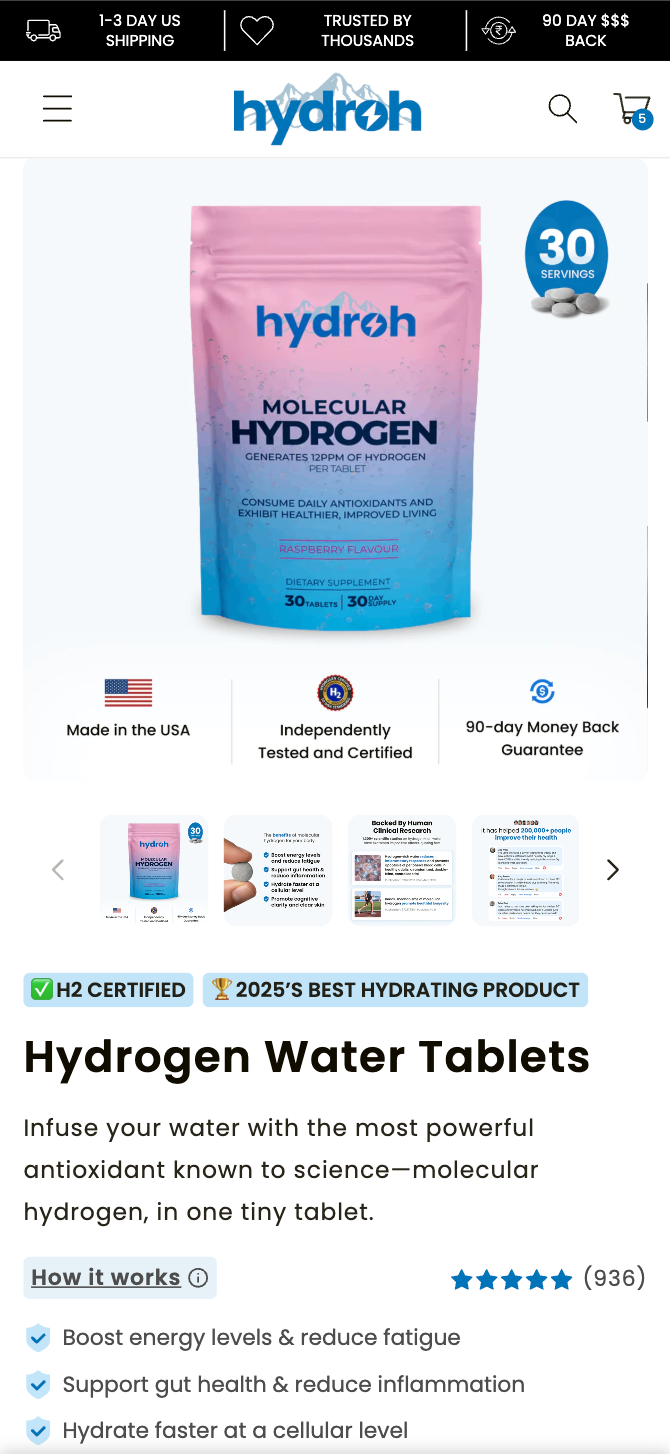
What we tested: Overhauled the product gallery images on the Hydrogen Water Tablets product page, swapping in a new set of product images (tagged "pdp_gallery_variant") while hiding the original images (tagged "hydrogen-water-tablets_control"). This replicated a similar image overhaul that previously won on the Bottle PDP. What happened: The new images lifted all key metrics, with the strongest impact on revenue per visitor. - Conversion rate: Control 2.75% vs Variation 2.96% (+8% lift for the variation) - Revenue per visitor: Control $2.05 vs Variation $2.38 (+16% lift for the variation) - Average order value: Control $74.50 vs Variation $80.26 (+8% lift for the variation) Statistical confidence: Variation has an 87% chance of being better on conversion rate, 94% on revenue per visitor, and 87% on average order value. The revenue per visitor result crosses the significance threshold. Subscription data: Subscription rates were similar between groups, but the Variation drove higher subscription revenue. - Subscription percentage of orders: Control 89.3% vs Variation 87.9% (slight 1.6% drop, 75% confidence for Control, not significant) - Subscription revenue per visitor: Control $1.77 vs Variation $1.98 (+12% lift, 86% confidence for Variation). This approaches statistical significance. - Subscription average order value: Control $72.19 vs Variation $75.91 (+5% lift, 76% confidence, not significant) - Subscription orders per visitor: Control 0.0245 vs Variation 0.0261 (+6% lift, 81% confidence, not significant but directionally positive) The image overhaul didn't change the subscription adoption rate (both groups had ~88-89% subscription orders), but the Variation drove more subscription revenue per visitor because more visitors converted overall and those who did spent slightly more per order. Device breakdown: - Mobile (93% of traffic): Variation won on revenue per visitor. Conversion rate Control 2.59% vs Variation 2.77% (+7% lift), 81% confidence. Revenue per visitor Control $1.89 vs Variation $2.21 (+17% lift), 94% confidence. The revenue per visitor result is statistically significant on mobile. - Desktop (7% of traffic): Variation leaned better. Conversion rate Control 4.73% vs Variation 5.58% (+18% lift), 82% confidence. Revenue per visitor Control $4.08 vs Variation $4.55 (+12% lift), 67% confidence. Small sample (50-59 orders) limits reliability. New vs returning visitors: - New visitors (67% of traffic): Variation leaned better. Conversion rate Control 2.96% vs Variation 3.14% (+6% lift), 77% confidence. Revenue per visitor Control $2.15 vs Variation $2.42 (+13% lift), 85% confidence. Approaching significance on revenue per visitor. - Returning visitors (33% of traffic): Variation won more strongly. Conversion rate Control 2.31% vs Variation 2.62% (+13% lift), 84% confidence. Revenue per visitor Control $1.83 vs Variation $2.29 (+25% lift), 89% confidence. The 25% revenue per visitor lift among returning visitors is the strongest segment-level result. Why it matters: The hypothesis was that updating the Tablets PDP images (replicating the Bottle PDP image overhaul success) would increase conversion. The data confirms this: the new images lifted conversion rate by 8% and revenue per visitor by 16%, with the revenue per visitor result reaching 94% confidence. The lift was consistent across both devices and both visitor types, with the strongest impact among returning visitors (+25% revenue per visitor, 89% confidence). This suggests the new images better communicate product value to users who are already familiar with Hydroh, helping them commit to higher-value purchases. The subscription revenue per visitor also lifted (+12%, 86% confidence), indicating the image overhaul benefits the subscription business without changing subscription adoption rates. Note: This test ran for approximately 9 days (March 18-27, 2026) with ~30,100 total visitors and ~859 orders. The sample size is moderate, and while the overall conversion rate result (87% confidence) is just below the ideal 85% threshold, the revenue per visitor result (94% confidence) crosses it. Combined with the consistent directional signal across all segments and the replication of the Bottle PDP success, this is a strong result.
Want tests like this on your store?
Free teardown: we walk your store live and show you the three highest-impact tests we would run first.